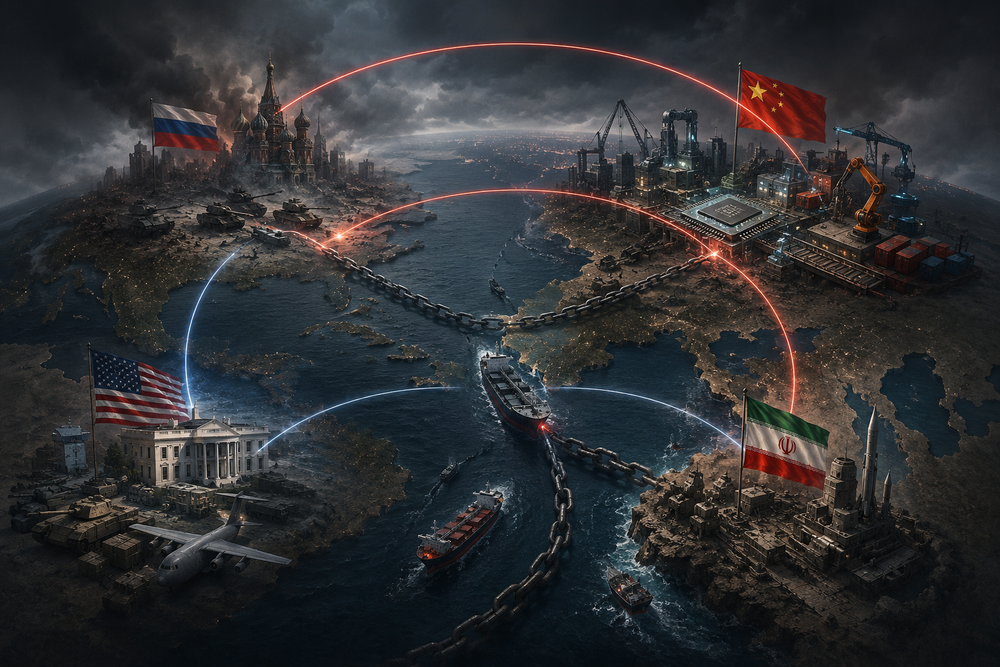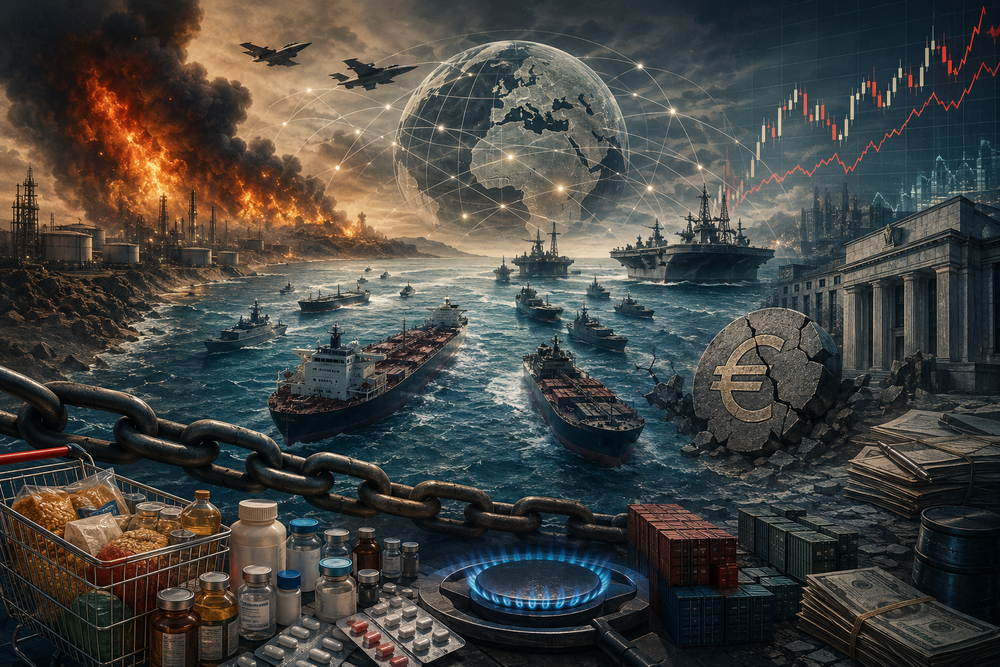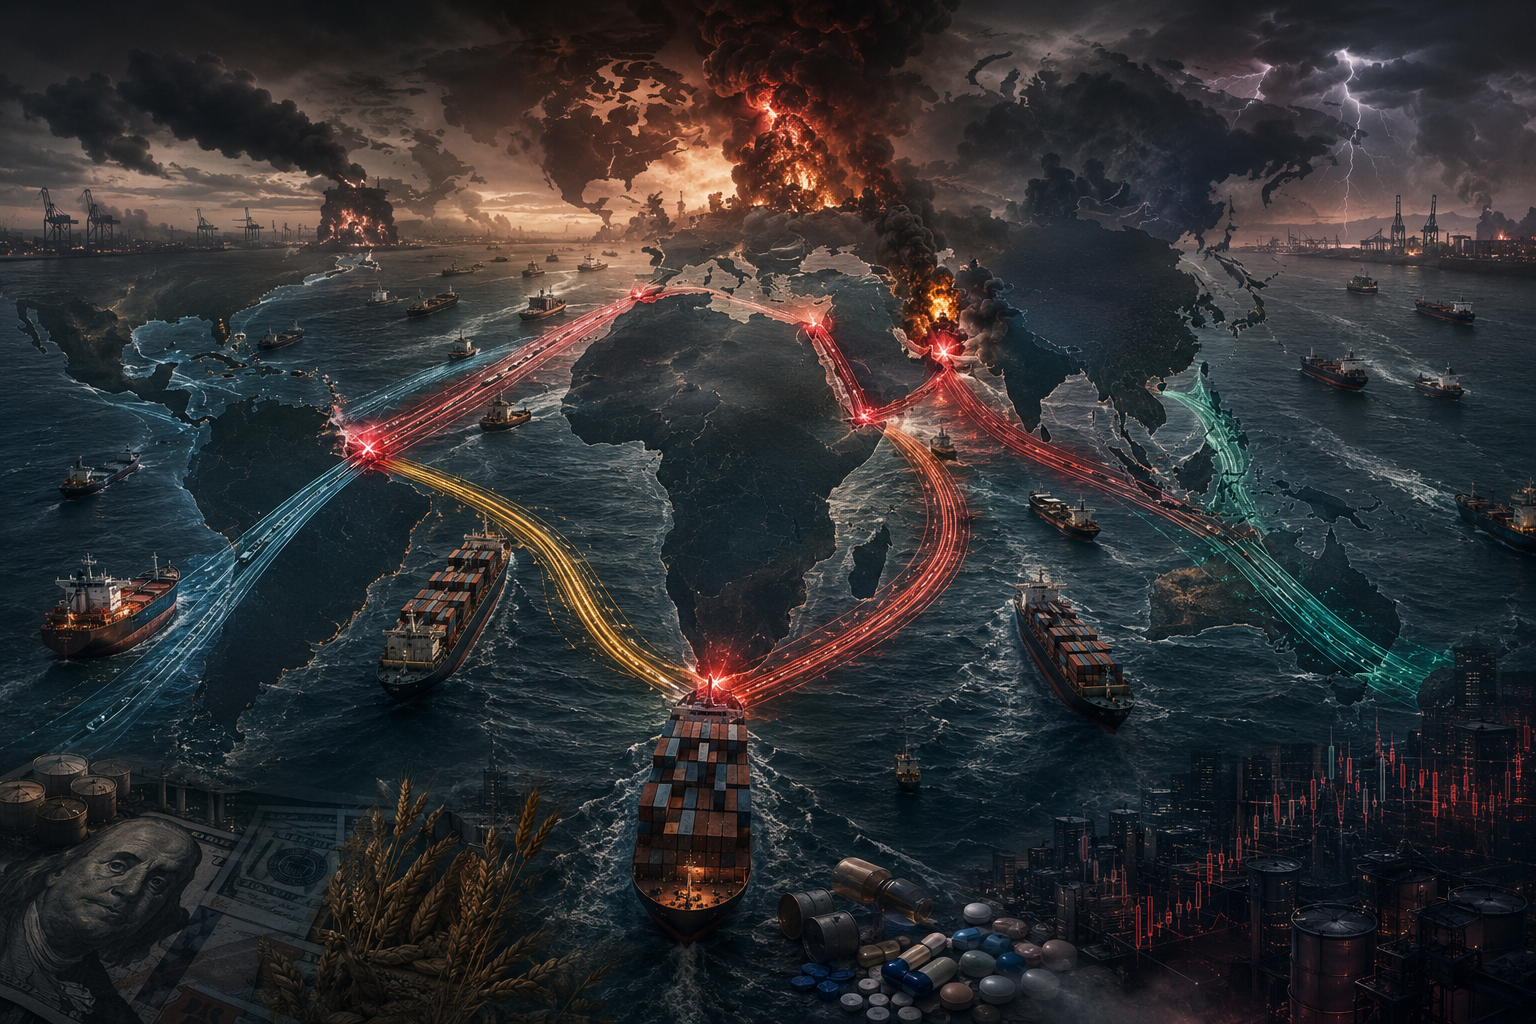
The global shipping network was built to survive a crisis at any single chokepoint. The logic is simple and structurally sound: when one route closes, divert to the alternative. When the Red Sea becomes dangerous, go around Africa. When the Panama Canal is constrained, use other transpacific lanes. When Hormuz is threatened, export through Yanbu and the Red Sea. For fifty years, this redundancy held. Through oil embargoes, wars, the Ever Given, Houthi attacks, drought at Panama, the alternatives always absorbed the traffic. The backup routes existed. The system adapted.
The architecture assumed the backups would be independent of whatever was causing the original disruption. That assumption held because the disruptions were independent, sequential, and short. One route at a time. One crisis resolving before the next began. The alternatives had time to recover between uses.
As of late July 2026, none of those conditions hold. Three of the four major maritime bypass routes are under active threat or restriction simultaneously. The fourth is operating near the limits of the shipping system's effective spare capacity, absorbing the combined rerouting traffic of the other three. Each entered crisis through a different proximate cause. Each is failing in a different way. But they are connected through the physics of where traffic goes when a route closes: when one route sheds its load, the load appears somewhere else, and where it appears, it consumes the capacity that was the next backup.
Any shipping model that treats the remaining routes as independent, unconstrained alternatives is currently wrong. Not because the alternatives do not exist on a map. Because they are full.
The Redundancy Model and Its Blind Spot
The assumption built into global maritime logistics over fifty years is that geographic redundancy provides systemic resilience. The Suez Canal and the Cape of Good Hope serve the same east-west corridor. The Panama Canal and transpacific routing serve the Pacific crossing. The Strait of Hormuz and Yanbu on the Red Sea both carry Persian Gulf crude. No single disruption, the architecture assumed, would close all the alternatives simultaneously.
The assumption had been tested repeatedly and held. The 2021 Ever Given blockage of the Suez Canal lasted six days. The global economy absorbed it. The 2023 Houthi attack campaign on Red Sea shipping forced a large-scale rerouting around the Cape of Good Hope, adding ten to fourteen days to Asia-Europe transit times and roughly $500 million per week in additional industry costs, according to UNCTAD analysis and Maersk investor communications. The Cape absorbed it. When El Nino drought reduced Panama Canal capacity to as few as eighteen daily transits in late 2023, global shipping adapted. Each disruption was absorbed because the alternatives existed and had capacity to spare.
The 2026 configuration differs in kind, not degree. No directly comparable configuration has been identified in the institutional record of modern containerized shipping: three of the four primary bypass routes simultaneously under active stress, while the fourth is absorbing their combined rerouting traffic. The system has not failed because any single disruption was too large. It has failed because the disruptions arrived before the alternatives could recover from each other.
The backup routes are not parallel. They are sequential. Each carries the load that the previous route shed, and has less capacity to carry it.
The International Energy Agency, which tracks global energy flows as its institutional core function, described the Hormuz disruption as the largest oil-supply disruption in history. That assessment was made before the Houthi maritime embargo on Saudi Arabian ports, announced July 20, 2026. It was made before the Panama Canal Authority announced a further reduction in authorised vessel draft, effective July 24. The IEA was measuring one chokepoint. What the subsequent month produced was simultaneous pressure on the three routes that were supposed to compensate for Hormuz.
What the redundancy model does not account for is the condition in which rerouting traffic from one disruption becomes the mechanism that degrades the capacity of the next alternative. Traffic is not abstract. It is physical vessels moving through physical channels with finite capacity. When vessels are redirected from a closed route, they do not vanish. They appear somewhere else. And where they appear, they consume capacity that was previously available as a buffer for the next crisis.
Hormuz: Day 147
The Strait of Hormuz has been effectively closed to international commercial shipping since February 2026. The pre-crisis baseline was eighty-eight commercial transits per day through the strait. As of July 26, recorded daily transits stand at fifteen. That is an 83 percent reduction in throughput at a point through which approximately one-fifth of global oil and petroleum consumption, more than a quarter of seaborne oil trade, and approximately one-fifth of global liquefied natural gas trade normally flows.
The physical cause is the ongoing US-Iran military engagement. United States forces conducted ten consecutive nights of strikes against Iranian military infrastructure through the third week of July, targeting what US Central Command described as threats to commercial navigation. Iran responded by formally exiting the memorandum of understanding that had established limited de-escalation protocols, and by resuming attacks on commercial vessels that do not use the designated northern transit corridor. Greek-owned Dynacom Tankers vessels were struck on July 19 and 20. A separate tanker was reported to have exited the region with its AIS transponder disabled the following day, indicating the vessel had chosen to make itself invisible to tracking systems rather than transit under observation.
The insurance landscape has moved independently of the physical closure in ways that compound it. Lloyd's Joint War Committee has designated the strait as an active war risk zone, triggering premium increases of $10 to $14 million per VLCC voyage over the baseline. Insurance has not disappeared uniformly. But formal availability is no longer equivalent to operational availability. Premiums, exclusions, charter-party provisions, crew consent, and war-risk clauses together remove a portion of the fleet from practical consideration even where cover can technically still be purchased. For a subset of operators, Hormuz has not become more expensive. It has become unavailable at any price.
The closure is not an event. It is an architecture of constraint that has outlasted every model built for single-crisis shipping disruption.
No diplomatic framework for resolution has emerged that carries credible momentum. Iranian and American negotiating positions remain structurally incompatible on uranium enrichment levels and the sequencing of sanctions relief. The Hormuz closure is not a disruption awaiting resolution. At 147 days, it has become the operating condition against which the rest of the global shipping network is required to function. The global shipping network did not run out of capacity at Hormuz. It ran out of alternatives.
Bab el-Mandeb: The Backup That Became the Target
Saudi Arabia exports crude oil through two geographically distinct channels. The first is the Persian Gulf terminal infrastructure whose primary export route transits Hormuz. The second is the Red Sea terminal at Yanbu, which connects directly to the kingdom's eastern oil fields through the East-West Pipeline, also known as Petroline. Yanbu was designed as the explicit institutional answer to Hormuz dependency. When the strait is unavailable, Saudi crude can still reach European, African, and Asian markets through the Red Sea without any contact with Hormuz. The architecture of Yanbu is a deliberate response to the chokepoint risk at Hormuz, built precisely for the kind of disruption that began in February 2026.
On July 20, 2026, at 12:00 UTC, the Houthi movement announced a complete maritime embargo on Saudi Arabian ports and terminals. Vessels calling at Saudi facilities, including Yanbu, were warned they could be targeted at any point within Houthi operational range. Two Saudi-flagged tankers were attacked within the first forty-eight hours of the declaration. Bloomberg reported oil prices crossing $100 per barrel on July 23, a rise of approximately 12 percent over four trading days. The price signal reflects the anticipated cost of routing Saudi crude to market when the maritime channel it depends on for export is under active attack, and when the insurance infrastructure for that channel is contracting as underwriters reassess the Red Sea and Bab el-Mandeb risk profile.
The geometry of the problem is not resolvable by rerouting. The Suez Canal sits at the northern terminus of the Red Sea. Vessels loading at Yanbu that choose not to transit Bab el-Mandeb have no viable alternative exit. There is no Yanbu bypass. Yanbu is the bypass. It was not located outside the conflict theater. It was located within the same geographic space as the original threat, and it depends on a maritime corridor now under the same operational pressure as the corridor it was designed to replace.
Yanbu was not an alternative to the problem. It was the alternative. Its exposure to the same threat eliminates the redundancy it was built to provide.
The July 20 embargo is structurally distinct from the Houthi attacks of 2023 and 2024. The earlier campaign targeted vessels linked to Israel or Israel-affiliated shipping, which allowed carriers with no such links to continue transiting with elevated but manageable risk. The July 20 embargo targets Saudi ports and terminals as such. Every vessel destined for Yanbu is now within the declared target set regardless of flag, ownership, or cargo. Both primary export mechanisms for one of the world's largest oil exporters are simultaneously constrained. The design assumption was that only one would be constrained at a time.
Panama and the Cape: When the Bypasses Fill Up
When the Red Sea corridor became effectively unusable for most international carriers following the Houthi campaign of late 2023, global shipping adapted through two primary pathways. Asia-Europe routes shifted to the Cape of Good Hope. Transpacific cargo added pressure to the Panama Canal and direct Pacific routing. Both alternative routes absorbed elevated traffic. Neither was designed to carry that volume indefinitely as a permanent operating baseline.
The Panama Canal had demonstrated its structural fragility before the Hormuz crisis began. The El Nino drought of 2023 and 2024 reduced Gatun Lake to historically low levels. At the peak of the drought, the Panama Canal Authority cut daily transit allocations to as few as eighteen. The canal recovered as rainfall returned. Capacity was substantially restored through the first half of 2026.
On July 22, 2026, the Panama Canal Authority announced a further reduction in the maximum authorised draft for Neopanamax vessels, effective July 24, to 14.94 meters. The adjustment is limited in direct operational scope, affecting only a small share of Neopanamax vessels. But it matters as a directional signal: the canal is losing marginal carrying flexibility at precisely the moment the wider network needs additional slack. Gatun Lake is tracking below its five-year seasonal average for late July. The National Oceanic and Atmospheric Administration has updated its seasonal outlook to include elevated probability of El Nino conditions developing by the northern hemisphere autumn.
The geopolitical dimension of the Panama Canal adds a layer the hydrology does not capture. In February 2026, the Supreme Court of Panama ruled to revoke the operating contracts held by CK Hutchison, the Hong Kong-based conglomerate managing port facilities at both ends of the canal, following sustained pressure from the United States government. The Panama Canal is no longer being treated by any of the major powers as neutral infrastructure. It is contested as a strategic resource at exactly the moment when the global shipping network most needs it to function as a stable alternative.
The Cape of Good Hope faces no formal restriction and no announced emergency. It faces something the other three chokepoints do not: an invisible constraint. For vessels that must still move between the Indian Ocean and the Atlantic, the Cape is the remaining large-scale maritime alternative. Transit times on the Cape route are the longest of any major maritime corridor, which means more vessels are simultaneously in transit at any given moment to carry the same volume of cargo. An open route operating near the limits of its effective spare capacity is not a backup. It is a constraint that has become invisible because it has no official closure date.
The world did not run out of routes. It ran out of capacity on the routes that remained.
The Transmission Chain
S&P Global published an analysis in April 2026 documenting that rerouting from the Strait of Hormuz was generating measurable pressure on secondary maritime chokepoints, including the Panama Canal and the Malacca Strait, and that "network congestion is becoming the primary channel for global trade disruption" rather than individual chokepoint closures. A peer-reviewed study published in Nature Communications provides a quantitative framework for how delays, rerouting, insurance costs, and trade exposure allow disruption at maritime chokepoints to propagate beyond the node where it began. Applied to simultaneous disruptions, that framework indicates that each impaired alternative reduces the network's capacity to absorb the next shock.
The four chokepoints under current stress span the Persian Gulf, the Red Sea, the Atlantic-Pacific crossing, and the southern Atlantic. They are not geographically adjacent. But they are adjacent in the functional network. Hormuz closure routes traffic to the Red Sea. Red Sea pressure from the Houthi campaign routes traffic to the Cape. Cape absorption near effective capacity limits adds pressure to Panama for any cargo that can use it. Each step places load on the next node. Each node was already carrying its pre-crisis baseline load before the cascade began.
The transmission operates through three distinct mechanisms that interact rather than simply add. First is traffic diversion: vessels that cannot transit a closed or dangerous route must use an alternative, and that alternative must accommodate them. Second is vessel absorption: longer alternative routes require vessels to spend more time in transit, which reduces the effective fleet available for new shipments. If a route operated with one departure per day and transit time increased from thirty to forty-four days, maintaining the same service frequency would require roughly fourteen additional vessels in the rotation. Third is the insurance and financial complexity layer: war risk zone designations, rerouting surcharges, and hull insurance exclusions create financial constraints that concentrate traffic on remaining lower-risk alternatives.
These three mechanisms interact in ways that are not additive. A 30 percent reduction in throughput at one node does not produce a 30 percent effect on the network. It produces a larger effect because of cascading load on adjacent nodes that were not designed to absorb it. [1] The system is not broken in three places. It is degraded in three places simultaneously, and the degradation compounds.
[1] A precise quantification of the nonlinear compounding effect would require real-time simultaneous throughput data from all four chokepoints, data that is not publicly consolidated at the time of writing. The S&P Global and Nature Communications analyses cited here document the direction of the effect, not its precise magnitude in the current four-chokepoint configuration.
The network is not broken. It is full. And it has no release valve.
The commodity markets are already reflecting this: oil has crossed $100 per barrel; food prices have risen an estimated 2.7 percent from the fertilizer and freight cascade according to S&P Global; US retail gasoline averaged $4.09 per gallon in the third week of July. These are not forecasts. They are the cost of the transmission mechanism operating in real time, before the longer-duration consequences have appeared.
The Strait of Malacca, the primary corridor for more than 80 percent of China, Japan, and South Korea's oil imports, has not experienced formal restrictions. It is receiving elevated traffic from Asian cargo that can no longer route efficiently through the Indian Ocean corridors. The Strait of Malacca is one of the next nodes on which displaced Asian energy and cargo flows can concentrate. It is not yet formally constrained. But as the network loses flexibility elsewhere, its role becomes more critical and the consequences of any additional disruption become larger.
What Breaks If They Stay Closed
The world built four bypass routes because it knew one would eventually fail. That institutional assumption was correct: individual disruptions have a backup. What the model did not account for is correlated failure, the condition in which rerouting traffic from one disruption loads the next alternative, progressively reducing its capacity to absorb the disruption that follows. A network cannot maintain independent backup routes when all backup routes must absorb the same traffic stream. The moment one route closes and the others compensate, they are no longer independent. They share capacity. Their failure modes correlate. This is a mathematical property of networks under correlated load, not a property of geography or geopolitics. The redundancy designed to survive individual disruptions does not survive the condition in which the disruptions are not individual.
Under conditions unchanged from late July 2026, the following sequence is structurally predictable from institutional data currently available. This is not a forecast. It is the cascade as it is running, projected forward under the assumption that no route returns to pre-crisis throughput before September.
What follows is not separate sector-specific crises unfolding on separate timelines. It is one transmission chain. Each link feeds the next.
Shipping costs are the baseline mechanism: when routes close, vessels reroute; when transit times lengthen, effective fleet capacity falls; when fleet capacity falls, freight rates rise. What operates less visibly is the simultaneous contraction of the insurance market. Lloyd's Joint War Committee has designated Hormuz as an active war risk zone, triggering $10 to $14 million per voyage in premium increases for large tankers. The extension of that designation to Bab el-Mandeb is underway following the Houthi Saudi embargo. The commercial infrastructure that makes global shipping legally and financially possible is contracting faster than vessel traffic.
From insurance, the cascade moves to energy. Oil has crossed $100 per barrel. Taiwan carries approximately eleven days of liquefied natural gas reserve. Its LNG supply arrives primarily via Indian Ocean routes that are now disrupted. Semiconductor production, one of the most energy-intensive industrial processes, is already facing elevated and uncertain energy input costs. The threshold at which production scheduling decisions change is a gradient. The industry is already on it.
Within weeks of sustained disruption, energy costs reach food systems. Fertilizer production in the Persian Gulf region transits Hormuz as its primary export route. Alternative routing adds cost. Higher energy translates into higher fertilizer prices regardless of source; higher freight rates make inputs more expensive for import-dependent agricultural economies; and the World Food Programme's pre-embargo estimate of an additional 45 million people at elevated food insecurity risk grows with each week the disruptions continue.
Pharmaceutical supply chains travel the same Indian Ocean routing as agricultural inputs, with the same just-in-time inventory design. A large share of global generic-drug inputs, active pharmaceutical ingredients, and key starting materials is produced in India and China, while Indian manufacturing remains heavily dependent on Chinese inputs for critical compounds. Manufacturing facilities in Europe and the United States typically carry six to twelve weeks of API stock. When the routing disruption extends past that window, facilities without secured alternative sourcing begin operating at reduced production capacity. The crisis appears first in procurement communications, then in formulary restrictions, then in market shortages of specific compounds, each step delayed enough that the cause is no longer legible in the effect.
By six months, the cascade reaches sovereign finance. Seventy-five countries were already in active debt distress before the Hormuz closure. Those countries are disproportionately net energy importers paying for fuel in dollars. Egypt imports more than 60 percent of its wheat through corridors now disrupted and carries a dollar-denominated external debt load against a currency that lost 40 percent of its value in the preceding two years. Pakistan relies on Indian Ocean LNG routing for a power grid already operating under rationing protocols. Turkey, Argentina, and Nigeria carry the same structural profile: dollar debt, energy imports, export revenues that depend on the affected maritime corridors. The vise closes differently in each country. The mechanism is the same in all of them. Higher energy prices, constrained access to maritime export routes, and the accelerating erosion of the petrodollar architecture create pressure on three simultaneous dimensions: import costs rise, export revenues are disrupted, and countries remain locked into dollar-denominated obligations while the monetary architecture supporting those obligations becomes less stable.
The petrodollar architecture that Kissinger built in 1974 rested on a single geopolitical assumption: the United States could guarantee oil flow through the Persian Gulf. For fifty-two years, no sustained disruption challenged that assumption at scale. Hormuz day 147 is the first documented instance of that assumption failing in real time. Countries that cannot route oil through the strait are not choosing alternatives as a strategic preference. They are being forced to them by the physical closure of the primary channel. Yuan-denominated oil contracts, barter arrangements, and non-dollar settlement mechanisms that were a directional trend before February 2026 are being accelerated toward operational use. The dollar's share of global central bank reserves had already declined from approximately 70 percent at the start of the century to approximately 57 percent in the first quarter of 2026, according to IMF reserve composition data. What the Hormuz closure has done is accelerate the structural proof: the dollar's reserve role was built on an energy guarantee that the current conflict has invalidated. The crisis does not disprove the dollar. It proves what was previously only a trend.
The cascade does not announce itself. It appears in procurement communications before it appears in headlines: a hospital group extending its API stock order by sixty days, a fertilizer distributor requesting alternative routing quotes, a sovereign bond desk quietly raising its risk premium on Gulf-exposed economies. By the time the shortage is visible in a market or a news report, the cause is ninety days upstream. The sentinel events are already in the data. They are not yet in the narrative.
No multilateral facility is designed to address all of this simultaneously.
The routes did not fail. The architecture that connected them did.
The Strongest Counterargument
The strongest objection to the reading offered here is that these four chokepoints are under stress for independent reasons, and that framing their simultaneous stress as a single system imposes a causal structure on what is fundamentally a coincidence of independent events. Hormuz is a geopolitical crisis specific to the US-Iran military engagement. The Houthi embargo on Saudi Arabia reflects the Yemen conflict. Panama's water levels depend on rainfall and ENSO climate patterns. The Cape congestion accumulated from the earlier Houthi Red Sea campaign, which was a separate event from the 2026 US-Iran conflict. Each crisis has its own proximate cause. Those causes are genuinely independent of each other. No actor produced all four simultaneously. No institution coordinated them. They converged without coordination, and the convergence is the analysis.
This counterargument correctly identifies that each chokepoint has its own proximate cause. The reading offered here does not dispute this. It claims something narrower: that the physical reality of traffic flow creates a mechanical connection between these independent proximate causes, and that the network effects of that connection are what the standard analysis of individual chokepoints does not capture. S&P Global documented this connection explicitly in April 2026, before the Yanbu embargo and before the Panama tightening, using the language of pressure transmission between network nodes. The Nature Communications research on systemic chokepoint disruption provides the academic framework for why this is structurally expected, not coincidental. The argument is not that these crises are coordinated. It is that they are connected through the physics of where the traffic goes when a route closes, and that the connection is measurable, documented, and ongoing.
The specific falsifying conditions for this reading: if primary shipping data showed no statistically significant relationship between Hormuz rerouting volumes and congestion metrics at Panama or the Malacca Strait, the transmission chain argument would require revision. The available institutional sources, including S&P Global and Lloyd's List Intelligence, report the opposite. If Gatun Lake returns to above-seasonal-average levels by September 2026 and Panama transit allocations are restored, the Panama component would be substantially resolved. If the Houthi Saudi embargo is lifted within 30 days and Yanbu traffic resumes at pre-embargo levels, the Bab el-Mandeb component would be contained. These are the conditions under which the reading offered here would be substantially wrong. They are also the conditions whose absence, as of late July 2026, describes the current operating environment.
Evidence Map
Claim: The global maritime network's four major bypass routes are simultaneously under stress because each successive disruption transferred additional load to the next available route, progressively eliminating systemic slack. The redundancy model fails not because any single disruption exceeded individual capacity, but because the disruptions arrived before the alternatives could recover from absorbing each other's traffic. The determining mechanism is correlated network failure, not independent simultaneous crisis.
Scope: This analysis addresses the network effect of correlated maritime disruptions documented from February to July 2026. It does not claim that all four disruptions will remain at current severity, that the transmission chain operates independently of diplomatic resolution, or that sector-specific consequence timelines are precise predictions.
Evidence: Hormuz: 15 transits/day vs. 88 baseline, day 147. IEA described the closure as the largest oil-supply disruption in history (Lloyd's List Intelligence, IEA). Bab el-Mandeb: Houthi maritime embargo July 20 12:00 UTC, two tanker attacks confirmed within 48 hours, oil above $100/barrel +12% in four trading days (Bloomberg, Al Jazeera). Panama: Gatun Lake below 5-year seasonal average, Neopanamax draft restriction to 14.94m effective July 24 (Panama Canal Authority), El Nino probability elevated in NOAA seasonal forecast. Cape of Good Hope: absorbing combined Suez and Hormuz rerouting at or near limits of effective spare capacity (S&P Global, Lloyd's List). Network transmission: S&P Global (April 2026): "network congestion is becoming the primary channel for global trade disruption." Nature Communications (2026): quantitative framework for how disruption propagates through maritime chokepoint networks via delays, rerouting, insurance costs, and trade exposure.
Limitations: No directly comparable configuration has been identified in the available institutional record. Sector-specific consequence projections rely on structural analysis and prior disruption patterns, not observed outcomes. The model documents direction of network pressure, not precise magnitude. Precise quantification of nonlinear compounding requires real-time consolidated throughput data not publicly available at time of writing.
Alternative Explanations: The strongest objection is that four genuinely independent proximate causes converging simultaneously reflects coincidence rather than a single network failure. Each proximate cause is genuinely independent. The reading offered here claims something narrower: the physics of traffic flow creates a mechanical connection documented by S&P Global and predicted by the Nature Communications framework. The convergence is not coordinated. It is structural.
Falsification Criteria: Primary shipping analytics showing no statistically significant correlation between Hormuz rerouting and Panama or Malacca congestion would require revision. Gatun Lake returning to above-seasonal-average by September 2026 with Panama transit allocations restored to pre-restriction levels would substantially resolve the Panama component. Houthi embargo lifting within 30 days with Yanbu traffic at pre-embargo levels would resolve the Bab el-Mandeb component. These are the specific conditions under which this reading would be substantially wrong.
Watchlist: Gatun Lake daily water levels. Panama Canal Authority draft restriction and transit allocation announcements. Houthi confirmed strikes on Yanbu-bound vessels and any modification of July 20 embargo. IEA strategic reserve release volume. NOAA El Nino seasonal forecast updates for Q3/Q4 2026. Lloyd's JWC war risk zone designation changes for Bab el-Mandeb. Malacca Strait traffic volume for statistically significant increase above pre-crisis baseline.
Every successful reroute consumed part of the capacity the next crisis would need. The backups did not disappear. They became the system.
The downstream cascade of what these closures mean for supply chains, trade finance, food security, and financial markets is documented in Everyone Is Watching Hormuz. Nobody Is Adding Up What It Breaks. The strategic context that makes the US-Iran conflict structurally irresolvable is analyzed in Everyone Is Watching the Iran War. Nobody Sees Why It Cannot End. The military and legal ceiling that ended Operation Epic Fury while Hormuz remained closed is traced in Epic Fury Ended May 5. Hormuz Was Still Closed May 6. The IEA buffer depletion timeline running beneath this network failure is mapped in The Iran War Triggered the Largest IEA Reserve Release in History. The Buffer Runs Out in July.