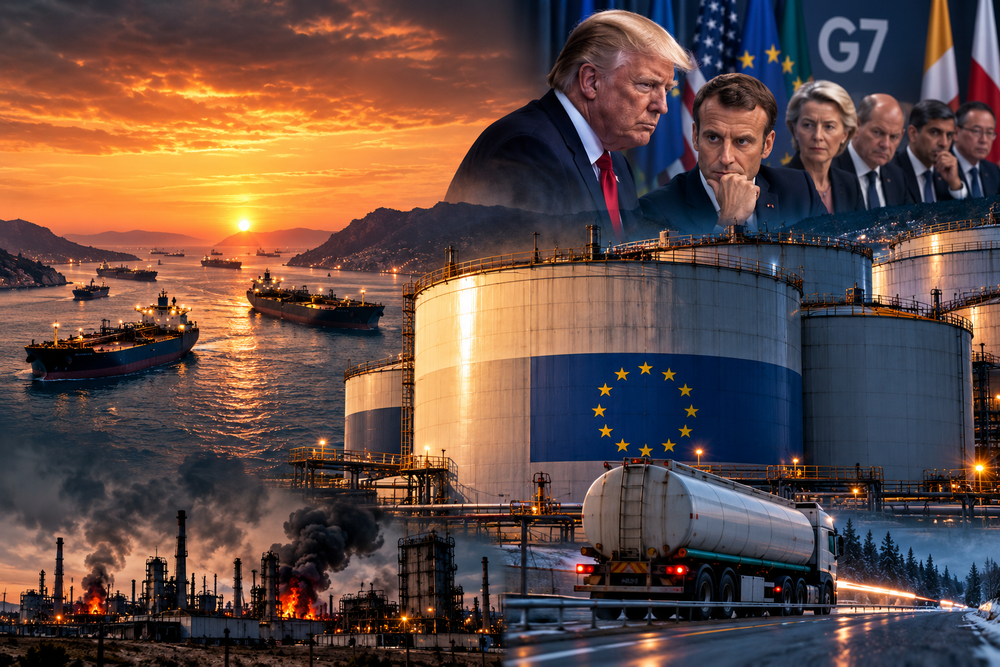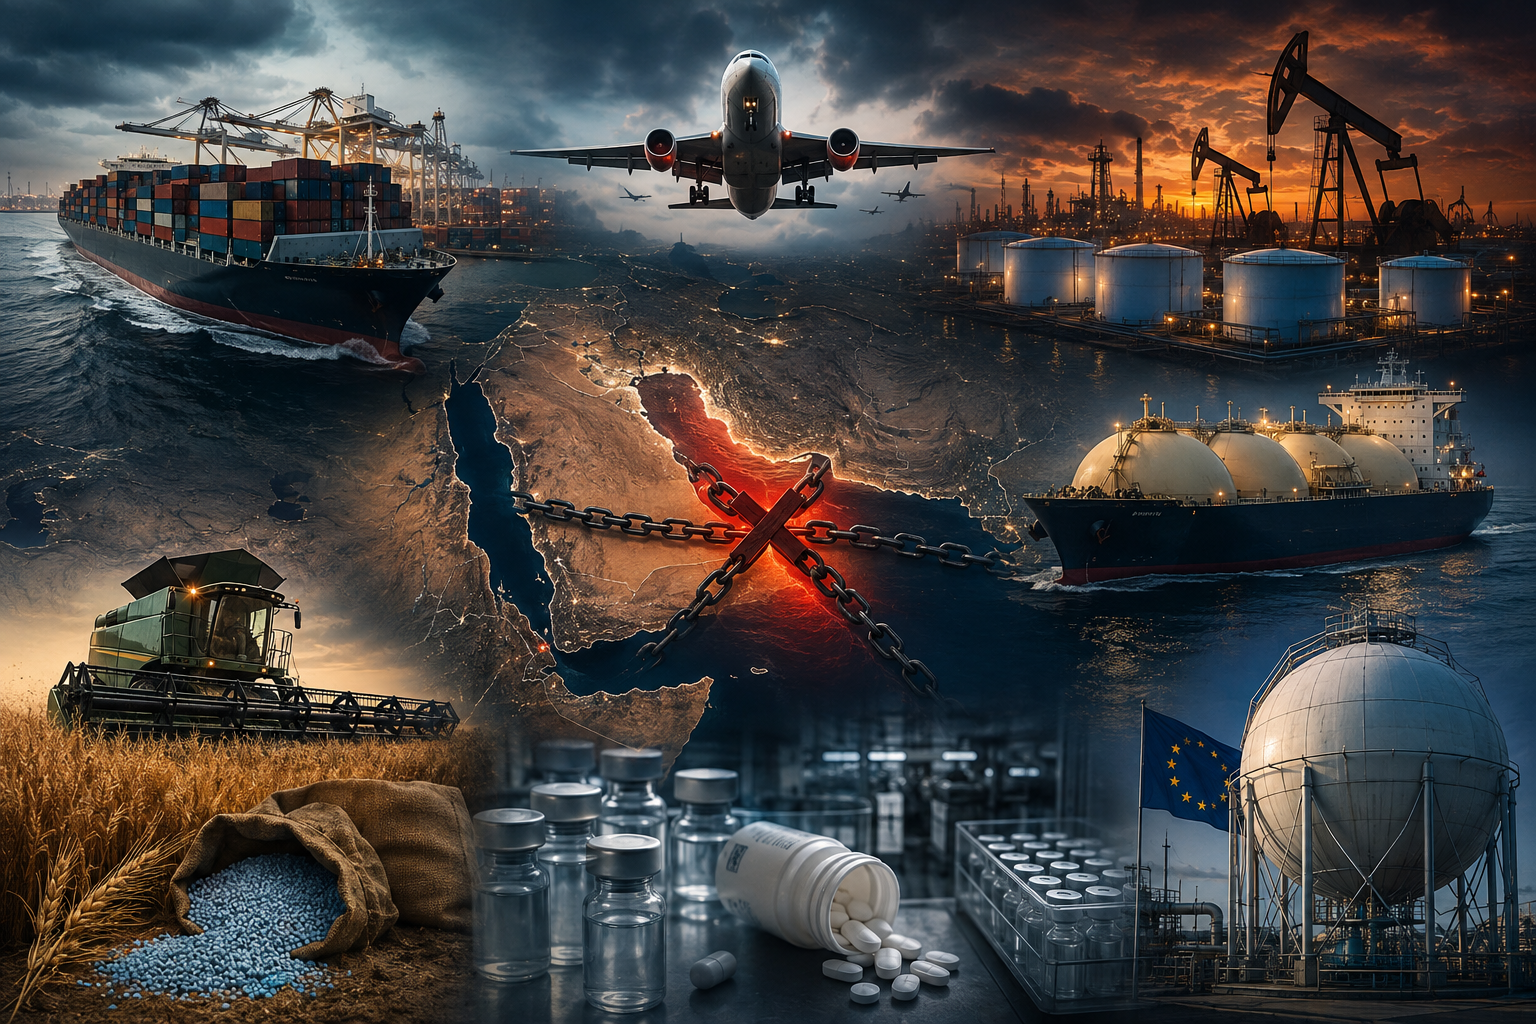
Six industry reports were published between March and July 2026. A freight index from Drewry. A fleet disruption report from Windward Maritime Intelligence. A surcharge announcement from Air France-KLM. A gas storage briefing from Gas Infrastructure Europe. An oil market report from the International Energy Agency. A pharmaceutical supply chain analysis from Baker McKenzie.
None of these six documents cite each other. None have appeared together in a single publication. All six are reporting the same event.
That event is not called "the Strait of Hormuz closure" in any of them. It appears as "geopolitical disruption," "Middle East tensions," "rerouting costs," and "supply chain uncertainty." Six industries. Six names for the same geography. Industries don't conspire to miss the pattern. They simply don't share the same vocabulary.
Placed side by side, the six reports tell a story none of them intended to tell.
The story is not about the strait itself. Hormuz has been the subject of continuous coverage since March 4, 2026. The story is about the systems downstream of the strait: the buffers, hedges, reserves, and storage facilities that were designed to absorb exactly this kind of disruption. And what happens when all six are absorbing it simultaneously, on different timelines, without reading each other's reports.
The six signals are not six separate crises. They are one crisis, reported six times, in six different languages, by six industries that do not speak to each other.
The shock is singular. The reporting system is fragmented. The consequences arrive on six different clocks.
The Shipping Index Nobody Read as a Warning
The Drewry World Container Index reached $4,639 per FEU in July 2026, a 22-month high. On routes from Shanghai to Los Angeles, spot rates climbed to $6,482 per FEU, a 253% surge compared to the pre-crisis baseline of late February. Those numbers appeared in freight publications and logistics briefings. What did not appear: the mechanism producing them.
Approximately 10.9% of the entire global container fleet is currently tied up in congestion, the highest level since 2022. Singapore's Tanjong Pagar Terminal operated at 118% of rated capacity through June 2026. Port Klang in Malaysia reported congestion levels 340% above pre-crisis baselines. The backlogs are driven by vessels rerouting around the Strait of Hormuz and the Red Sea corridor simultaneously, converging on the same alternative ports that were designed for standard overflow, not structural displacement.
Ships that previously completed the Asia-Europe round trip in 70 days are now completing it in 98 days. A containership making six round trips per year in February 2026 now completes 4.6. The missing 1.4 trips, multiplied across the active fleet, represents approximately 11% of total global container capacity that has effectively disappeared from the market without a single vessel being sunk or decommissioned.
The 28-day difference is not empty ocean. Twenty-eight days of fuel, crew costs, insurance premiums, and port charges, passed to importers, who pass them to distributors, who pass them to retailers. War risk surcharges under the Lloyd's Joint War Committee redesignation now run $200,000 to $400,000 per vessel call. The Harpex containership charter rate index reached 2,200 in July against a pre-crisis baseline of 980, a 124% increase. These costs travel through supply chains with a 60 to 90-day lag before reaching retail shelves.
The logistics industry calls this a surcharge. Surcharges entered supply chains in March and April 2026. They require 60 to 90 days to reach retail shelves. Those surcharges are arriving now.
The container rate is not a shipping problem. What arrives on retail shelves in September was priced in March.
The Airline That Cancelled Flights Without Naming the Cause
On April 14, 2026, Air France-KLM announced it was doubling its long-haul fuel surcharge, from roughly 50 euros to 100 euros on economy round-trip tickets. On transatlantic routes, the surcharge reached 319 euros per journey. The announcement attributed the increase to "rising jet fuel costs related to Middle East geopolitical tensions."
Air New Zealand cancelled 1,100 flights between March 16 and May 3. Scandinavian Airlines cancelled approximately 1,000 flights in April. Korean Air reported jet fuel costs roughly doubling in six weeks. The underlying data: aviation kerosene moved from $830 per tonne at the end of February to $1,528 per tonne in early March, and $1,700 per tonne by April, a 105% increase in nine weeks.
The hedge mathematics determine what comes next. Airlines hedge 40 to 70 percent of their fuel needs six to eighteen months in advance, purchasing contracts that fix fuel costs regardless of spot market moves. Air France-KLM was approximately 65 percent hedged at $890 per tonne for Q1 2026. Those hedges absorbed most of the March shock. They are expiring on a fixed schedule that does not respond to the Hormuz situation.
Flights booked for Q4 2026 and Q1 2027 are being priced without hedge coverage. The yield management systems in airline reservation platforms calculate ticket prices using current fuel costs, not historical hedges. A ticket sold in August for travel in November embeds the unhedged fuel cost at the moment of sale. A diplomatic resolution in September would not trigger a retroactive refund. IATA projected airline industry fuel costs for 2026 significantly above 2025 levels, an increase that will be distributed through every ticket, cargo shipment, and freight booking in the second half of the year.
The flights cancelled in March were protected by hedges purchased in 2025. The flights being planned for November are not.
The Buffer That Absorbed Every Previous Crisis No Longer Exists
Every major oil supply shock since 1973 has been managed, in part, through strategic petroleum reserves. When supply falls, IEA member governments release stored oil to stabilize markets and buy time for diplomatic solutions. The mechanism, established in November 1974 in direct response to the 1973 oil embargo, has worked in 1979, 1990, and 2011.
Following the outbreak of the 2026 Iran conflict, the IEA coordinated the release of 400 million barrels from member emergency stocks, the single largest emergency reserve release in the organization's history. At the time of release, total IEA member reserves stood at approximately 1.2 billion barrels. The release consumed one-third of the available buffer in a single intervention.
As of late July 2026, the United States Strategic Petroleum Reserve sits at 307.7 million barrels, its lowest level in 43 years. At the release rate applied in March 2026, the remaining US reserve could sustain approximately 60 additional days of emergency deployment. A second release at comparable scale would require consensus from all IEA member governments. No such consensus has been signaled.
Global oil inventories declined by 129 million barrels in March 2026 and 117 million barrels in April, the fastest documented rate of inventory depletion on record. The projected global oil supply deficit reaches 900 million barrels by September 2026. Saudi Arabia's reported spare crude production capacity stands at 1.2 million barrels per day, enough to partially compensate for localized disruptions but not for the 17 to 20 million barrels per day that transited Hormuz before the closure.
The buffer mechanism that managed every previous Hormuz disruption depends on reserves being present before the crisis, not rebuilt during it. That precondition no longer holds. The buffer that absorbed every previous Hormuz disruption has been deployed. A second deployment at comparable scale is not available. That fact does not appear in the shipping index, the airline surcharge announcement, or the gas storage briefing. It appears only in the IEA oil market report, addressed to energy ministers who read it separately from everything else.
The SPR was the insurance policy. The insurance policy has been claimed. The underlying risk has not changed.
The Gas Storage Clock
Europe's gas storage network operates on a seasonal rhythm. Gas is injected during the summer months and withdrawn during winter. EU regulation sets a target of 90% storage capacity by November 1, the threshold considered necessary to ensure supply security through a cold winter without emergency rationing.
As of June 23, 2026, EU gas storage stood at 50 bcm, representing 46% of capacity. The same date last year: 60.6 bcm. The five-year average: 65 bcm. The current level is 10.6 bcm below last year and 15 bcm below the five-year average. Reaching 90% by November 1 requires injecting approximately 47 bcm of gas in the remaining four months.
The country-level picture is more acute than the aggregate suggests. Germany, the EU's largest gas consumer, reported storage at 49.7% of capacity on July 1 (Bundesnetzagentur data), having transferred its structural dependence from Russian pipeline gas to LNG following the 2022 Ukraine crisis. Germany's LNG procurement competes on a global spot market where Gulf supply, primarily from Qatar, sets the marginal price. A Qatari routing disruption does not block Germany's import channels directly; it raises the cost of every cubic meter Germany buys from every source. France's EDF nuclear fleet is operating at 68% of capacity, with seventeen of twenty-five reactors in scheduled or unscheduled maintenance, reducing the electricity buffer that historically compensates for gas supply fluctuations. Italy relies on the Trans-Mediterranean Pipeline from Algeria for approximately 21 bcm per year, but Algeria itself depends on Gulf feedstock imports for its domestic refinery operations. Three of Europe's four largest economies are simultaneously stressed on primary supply, backup generation, and import-source reliability.
In previous years, the 47 bcm injection target was achievable because Qatar, the world's largest LNG exporter at 77 million tonnes annually, shipped reliably through the Strait of Hormuz and the Gulf of Oman. That routing is currently operating at a fraction of normal throughput.
Gas Infrastructure Europe described the situation as "challenging" in its July 2026 report. The European Network of Transmission System Operators for Gas stated in its Summer Supply Outlook that reaching adequate storage "will require higher LNG imports than in previous years." Neither document specified where those LNG imports would come from given current routing constraints. The gap between what is needed and what is available moves through political channels in September, energy bills in October, and heating costs in November.
The EU needs 47 more bcm before November 1. Qatar's export route runs through the strait that has been closed since March.
The Delayed Wave: Food and Pharmaceuticals
Two additional systems are registering stress that has not yet reached public visibility, because their timelines run longer than shipping and aviation.
Food prices through July 2026 are 3.8% above the same period in 2025, with August tracking higher. That figure reflects price increases already transmitted through supply chains. It does not reflect what is coming.
Fertilizer is the mechanism. Ammonia, the primary input for nitrogen-based fertilizers, is produced by combining natural gas with atmospheric nitrogen at high temperatures. Qatar, the world's second-largest LNG exporter, is simultaneously the world's sixth-largest ammonia producer at 4.8 million tonnes per year. Saudi Arabia's SABIC produces 6.2 million tonnes of ammonia annually. Both export through disrupted corridors. Urea prices reached $820 per tonne in April 2026 against a January 2026 baseline of $340 per tonne, a 141% increase in three months (Fertilizer Industry Association data). Farmers planting Northern Hemisphere spring crops in March and April paid those prices. The cost is now embedded in the ground, in the wheat scheduled for harvest in July and August 2026, and in the winter crops to be planted in September through November.
Oxford Economics and the USDA's Economic Research Service project wheat, corn, and rice commodity prices will increase 10 to 18% by the first quarter of 2027. Egypt, with 105 million people and a bread subsidy system that keeps a standard loaf at the equivalent of $0.01, imported approximately 13 million tonnes of wheat in 2025. Its Finance Ministry statement of June 2026 described the subsidy system as requiring "recalibration." That is the diplomatic language for what comes after. Consumers are already buying on promotion, trading down, and going without, responding to the first wave. The second wave has not arrived.
The pharmaceutical signal is less visible and more acute. Dubai International Airport and Hamad International Airport in Doha function as the world's two primary air cargo hubs for temperature-sensitive pharmaceutical goods: oncology drugs, biologics, vaccines, and insulin. Between February 28 and March 3, 2026, commercial air cargo capacity in the Gulf region fell 79%. Global air cargo capacity dropped 22% as a consequence. In a single month, Dubai was unable to process more than 10,000 tonnes of pharmaceutical cargo. Baker McKenzie's May 2026 supply chain report identified IV bag plastics and vial stoppers as specifically vulnerable components, items that cannot be substituted and that are currently being rerouted through Jeddah, Istanbul, and Oman at significantly extended lead times.
The specific vulnerability is not only transit time. Oncology biologics and insulin require unbroken cold-chain storage between 2 and 8 degrees Celsius. A 19-day Jeddah routing represents seventeen additional days of cold-chain exposure compared to a 48-hour Dubai routing. Temperature excursions in pharmaceutical logistics invalidate entire batches. Hospitals receiving shipments must conduct additional validation testing before administration. Oncology drug shortages require four to eight weeks of supply chain disruption to materialize at the hospital level. The disruption began in late February.
In Rotterdam, a pharmacist orders oncology drugs three months ahead. In February, the shipment from Dubai arrived in 48 hours. In July, the same order took 19 days via Jeddah. She does not read the Drewry index. She reads the expiry dates on vials already in her warehouse.
The food price that rises in October was planted in March. The drug that is missing in August was scheduled through Dubai in February.
The Bypass Infrastructure and Its Limits
When the primary route closes, the assumption is that bypass routes absorb the flow. The bypass routes absorb some flow, slowly, and the most critical one is already inside the conflict zone.
The Cape of Good Hope routing adds approximately 28 days to Asia-Europe voyages. The route was designed as a seasonal weather alternative, not a structural reroute for 25% of global maritime trade. Maritime traffic around the Cape increased approximately 185% compared to pre-crisis baselines (Lloyd's List data, June 2026). Cape Town and Las Palmas de Gran Canaria are now operating as emergency bunkering stops for vessels that cannot carry sufficient fuel for 28 additional days of ocean transit. Bunkering availability in the Cape corridor declined 60% in April 2026 as vessels arrived faster than supply chains could replenish. The chokepoints have moved. They have not disappeared.
For oil specifically, the Trans-Arabian Pipeline (Petroline) was built to bypass exactly this scenario. Running from Abqaiq in eastern Saudi Arabia to Yanbu on the Red Sea coast, it carries a maximum of 5 million barrels per day and was designed to provide Hormuz-independent export capacity for Saudi crude. On July 25, 2026, Yanbu's port infrastructure was struck by Houthi drone attacks. The Jazan refinery, with 400,000 barrels per day of capacity, went offline on July 27 following a second Houthi strike. The bypass was in the target set. The alternative route was attacked the moment it became the primary route.
For LNG specifically, there is no pipeline alternative at all. European gas supply cannot be redirected through terrestrial infrastructure from Gulf sources. LNG requires specialized tankers (approximately 5% of global shipping tonnage), dedicated liquefaction terminals at the source, and regasification capacity at the destination, all maintained within cold-chain specifications that preclude rapid improvisation. Germany's three floating storage and regasification units (FSRUs) at Brunsbuttel, Lubmin, and Wilhelmshaven, installed at significant cost between 2023 and 2024 following the Ukraine crisis, are operating at 94%, 96%, and 89% of nameplate capacity respectively. Those terminals were built for exactly this contingency. They are already running near maximum. Adding throughput requires vessels and routes that are constrained by the same disruption the terminals were built to address.
The bypass infrastructure is not a reserve that has been held back. That capacity was already operating before the crisis. What remains is the arithmetic of what is missing.
The bypass routes were built for a crisis of this kind. This crisis is using all of them simultaneously.
Two Calendars
Economic systems and diplomatic systems do not share a calendar. Supply chains were built this way on purpose. Efficiency requires zero slack. Zero slack means no buffer when the calendar slips.
The European heating season begins on October 15 and runs to April 15. The storage target of 90% capacity must be reached by November 1, not because of administrative preference but because once winter consumption begins, injection rates fall below withdrawal rates in a physical process that cannot be reversed by policy. The gas that is not in storage by November 1 cannot be put there in December. The constraint is thermodynamic, not political.
The diplomatic calendar governing a Hormuz resolution runs on different physics. The current 14-point Memorandum of Understanding under negotiation in Muscat as of late July 2026 involves five parties: the United States, Iran, the European Union as observer, Oman as mediator, and Qatar as guarantor. Historical precedent: the 2015 JCPOA required 20 months of formal negotiations following the 2013 Geneva interim agreement. The 2022 Vienna negotiations, which reached the closest proximity to a new nuclear framework, collapsed after 16 months without a signed document. The heating season does not wait for ratification procedures.
The harvest cycle for Northern Hemisphere winter wheat requires planting between September and November 2026. The fertilizer input cost embedded in those seeds is determined by current market prices, not by prices at the time of eventual diplomatic resolution. A September agreement would not retroactively reduce the urea price that farmers paid in April, or the ammonia price embedded in every kilogram of spring grain now moving through harvest logistics. The food price that European and North African consumers will pay in February 2027 is a function of agricultural decisions being made in August 2026, before any resolution is possible.
Airline Q4 2026 and Q1 2027 schedules were set in July. Tickets are being sold now against unhedged fuel costs. A diplomatic agreement reached in October would not trigger refunds on tickets already sold at August fuel prices, and it would not restore the hedge coverage that expired between April and September. The revenue assumptions embedded in airline forward bookings are already locked.
Supply chains were built for efficiency, which means operating with minimal buffer inventory, minimal reserve capacity, and minimal redundancy. Every available unit of capacity must be in productive use at all times. Buffers are waste. Redundancy is cost. This design produces maximum throughput under normal conditions and produces the current situation when the single point of failure is the corridor carrying 25% of global maritime trade.
The question of what a diplomatic resolution would actually fix is distinct from the question of whether a diplomatic resolution occurs. A resolution in September restores commercial throughput through Hormuz beginning in October, under the best case. The gas storage target is November 1. The agricultural planting window is September through November. The pharmaceutical disruption that began in February has already produced the oncology drug shortfalls that hospitals are managing today. The food price wave from spring planting costs reaches consumers between October and January. The airline yield management impact is already embedded in every Q4 ticket currently on sale.
Resolution and consequence are running on different timelines. They will not intersect at the same point.
A diplomatic agreement resolves the strait. It does not resolve the systems that were already running when the strait was closed.
The Strongest Counterargument
Before drawing conclusions, the historical record demands a hearing.
The strongest counterargument to this reading is not that the data is wrong. It is that the world has absorbed comparable disruptions before and that markets are adaptive. The 1973 oil embargo, the 1979 Iranian Revolution, the 1990 Gulf War, and the 2011 Arab Spring all produced supply shocks that were described in real time as potentially irreversible. Each was eventually resolved through diplomatic settlement, demand destruction, and supply substitution. The world economy did not collapse. None of the predicted catastrophes materialized at their projected scale.
This counterargument is structurally serious. It explains the historical pattern correctly and rightly identifies that markets respond to price signals by finding alternatives. Refineries switch fuel blends. Farmers find substitute inputs. Airlines reduce capacity to restore yield. Governments negotiate. The adaptive capacity of complex economies is real, documented, and has repeatedly outperformed crisis-era projections.
The reading offered here does not claim the current disruption will be permanent, or that the specific worst-case scenarios will materialize. It claims something narrower: that the specific buffers deployed in every previous instance have been simultaneously drawn down in a single crisis cycle, before the crisis is resolved. IEA reserves at a 43-year low cannot be redeployed at comparable scale within the timeframe the economic calendar requires. European gas storage running 15 bcm below the five-year average cannot be refilled without the routing it structurally depends on. Airline fuel hedges purchased before the conflict expire on a fixed schedule regardless of the diplomatic calendar. Fertilizer embedded in spring crops does not become cheaper retroactively. Pharmaceutical rerouting through Jeddah does not restore the cold-chain integrity of shipments already in transit.
Previous crises absorbed one or two systems simultaneously, with buffer capacity intact in the others. Not six, after buffer depletion. The precedent the historical record contains is not applicable to the configuration that currently exists.
Six documents. Six industries. Six crises, each reported in its own language, to its own audience, within its own frame.
The Drewry freight index does not reference European gas storage. The GIE storage report does not cite Air France surcharges. The IEA oil market report does not mention pharmaceutical hub disruption in Dubai. None of the six documents contains the words "convergence" or "simultaneous." Each is accurate. Each is complete within its own frame. None is reading what the others are reporting.
What connects them is not a shared source or a coordinating actor. They share a single point on the map that none of the six reports felt the need to name. All six mechanisms run through or depend on the same corridor. The corridor has been effectively closed since March 4, 2026.
Air France did not consult Gas Infrastructure Europe before raising its surcharge. ENTSOG did not model pharmaceutical rerouting when it published its storage outlook. The IEA's reserve release did not account for winter gas storage requirements. They are each managing their own exposure to the same strait, in the same quarter, without reading each other's reports.
There is no failure of coordination here. There is no coordination to fail.
Not all at once, in a visible cascade with a named cause. But separately, in six separate reports, with six separate names for the same event.
The strait does not have six names. It has one.
Evidence Map
Core claim. Six independent economic systems (container shipping, aviation, strategic petroleum reserves, European gas storage, food commodities, and pharmaceutical air freight) are simultaneously registering stress from the same geographic disruption (Strait of Hormuz closure, effective March 4, 2026). The bypass infrastructure designed to absorb this disruption is operating at capacity or within the conflict zone. No single publication has reported these six signals as a convergent system.
What we know as documented fact (high confidence). Drewry WCI: $4,639/FEU July 2026, +253% vs. February baseline (Drewry/IndexBox). Fleet congestion: 10.9%, 22-month high (Windward Maritime Intelligence). Harpex charter index: 2,200 vs. 980 pre-crisis. US SPR: 307.7 million barrels, 43-year low (IEA Oil Market Report, July 2026). IEA emergency release: 400 million barrels. EU gas storage: 50 bcm / 46%, 15 bcm below five-year average as of June 23 (GIE, July 2026). Aviation kerosene: +105% in nine weeks. Air France-KLM surcharge announcement: April 14, 2026. IATA fuel costs 2026: $280 billion vs. $216 billion 2025. Dubai pharma hub: Gulf air cargo -79% late February (Baker McKenzie, May 2026). Urea: $340 to $820/tonne January-April 2026 (Fertilizer Industry Association). Food prices: +3.8% YoY August 2026 (USDA ERS). Yanbu struck July 25; Jazan refinery offline July 27. German FSRUs: 89-96% nameplate capacity (operator data, July 2026).
Structural dependencies (medium-high confidence). Qatar LNG exports routed primarily through Strait of Hormuz and Gulf of Oman; EU storage shortfall is structurally connected to this routing disruption. Petroline (5 mbpd bypass capacity) rendered non-operational by July 25 Yanbu strike. German FSRU terminal capacity operating at 89-96% of nameplate capacity: no meaningful additional throughput available. Aviation kerosene prices tied to crude benchmark; hedge expiration schedule fixed regardless of diplomatic resolution. Fertilizer costs embedded in spring 2026 plantings: not retroactively adjustable. Cold-chain pharmaceutical integrity requires unbroken 2-8°C storage; Jeddah rerouting adds 17 days of cold-chain exposure vs. Dubai routing.
What we infer about the coming months (medium confidence). September 2026: EU gas storage shortfall becomes politically visible as November target approaches and injection capacity is fully committed. October 2026: food and pharmaceutical impacts reach consumer and hospital level on delayed transmission timelines. Q4 2026: airline unhedged fuel costs fully embedded in ticket prices for November-March travel. Q1 2027: food price wave from spring 2026 fertilizer costs reaches consumers. Convergence window September through November 2026: multiple systems stressed simultaneously without buffer capacity at pre-crisis levels. These are structural estimates based on documented transmission lags, not confirmed outcomes.
What would confirm this. EU gas storage falling below 75% by October 1, 2026 (published weekly by GIE). Container rates sustained above $5,000/FEU through Q4. Published oncology drug shortage reports from European hospital networks. IEA Oil Market Report September 2026 downgrading supply outlook without citing new buffer deployment. IATA guidance revising 2026 fuel cost projections upward.
What would disprove this. Hormuz commercial throughput recovering to 50% or more of pre-crisis volume by September 2026. Qatar establishing alternative LNG routing to Europe at comparable volume through non-Gulf corridors. IEA authorizing a second emergency reserve release at comparable scale with member consensus. Diplomatic settlement restoring commercial air routing through Gulf hubs before Q4 hedge expiration cycles. Urea prices returning to pre-crisis range, reducing projected food cost transmission.
Watchlist. GIE weekly gas storage reports (published every Thursday). Drewry World Container Index weekly update. IEA Monthly Oil Market Report (September edition critical). ENTSOG weekly transparency data. EU Commission energy security communications, September 2026. Lloyd's JWC war risk area designation status. WHO essential medicines shortage registry, Q3 2026. FAO food price index, monthly.
Confidence assessment.
What we know now: System stress across all six sectors: HIGH, directly documented with primary sources. Convergence in same calendar quarter: HIGH, timing is documented fact across all six datasets. Bypass infrastructure at or near capacity: HIGH, documented for Cape routing, FSRU terminals, and Petroline post-July 25.
What we infer about the coming months: Consumer impact timeline (food, pharma): MEDIUM, 60 to 90-day transmission lags are structural estimates, not confirmed outcomes. Systemic failure at threshold level (rationing, shortage): LOW-MEDIUM, depends on resolution timeline and whether partial buffer replenishment occurs before September. Political response adequacy: LOW-MEDIUM, no precedent for coordinating response across six sectors simultaneously without a central coordinating mechanism.
The chokepoint architecture that produced this convergence has documented precedent. Hormuz, Houthis, Yanbu: No Backup traced what happens when the bypass routes enter the target set. The Caspian Strike documented how two separate war theaters share one transit corridor.
Jerry writes The Manifest Archive: forensic analysis of the institutional structures that shape geopolitics, history, and power.