A tanker departs Ras Tanura on May 20, 2026. Twenty days later it should arrive in Rotterdam. It does not.
Nothing explodes. No headline appears. No politician gives a speech. Yet the entire system begins to tighten.
The tanker took an alternate route. Not because the direct route is blocked. Because insurance made it uneconomical. The alternate route goes around the Cape of Good Hope. This adds 10–14 days to the journey. One tanker. One route change. One month of delay.
Multiply this across hundreds of vessels. Multiply the consequences across every system that depends on that tanker's cargo: diesel, which powers trucks, which moves food, which feeds people.
No blockade is necessary. No declaration of war. Just the slow compression of a system operating under sustained stress.
The movement system surrounding the Strait of Hormuz is operating under significantly higher friction than historical norms. This is not a forecast. This is observable fact as of June 2026.
Oil inventories are being drawn down. Insurers have repriced war-risk premiums, making Gulf transit economically challenging for operators. Governments are discussing the consequences of sustained disruption. Tanker operators are evaluating alternative routes. Warehouses are drawing down inventory faster than they are replenishing it.
The question is no longer whether the Iran war affects the global economy.
The question is which physical system feels the effects first.
The Iran war matters not because of what it destroys militarily. It matters because it sits atop one of the most critical movement corridors on Earth. And for the first time in decades, that corridor is showing signs of sustained compression.
The deeper question is not about geopolitics. It is about logistics.
Transport Is Not a Service. It Is the Connective Tissue.
Walk into a supermarket in any developed country in June 2026. Shelves appear full.
Order a package online. It arrives within two days. Industrial output appears continuous. Factories operate. Supply chains hum invisibly.
This abundance is real. But it is not the result of massive stockpiles sitting in warehouses waiting to be purchased.
It is the result of continuous movement.
A shirt is not sitting in a warehouse in Vietnam. It is on a container ship transiting from port to port. A semiconductor is not stored in a facility. It is in a logistics hub, moving toward assembly. Crude oil is not sitting in tanks somewhere. It is being pumped, transported, refined, and consumed within days. Food is not in grain silos. It is on trucks, in trains, in refrigerated containers, reaching supermarkets before it expires.
The system works because movement never stops.
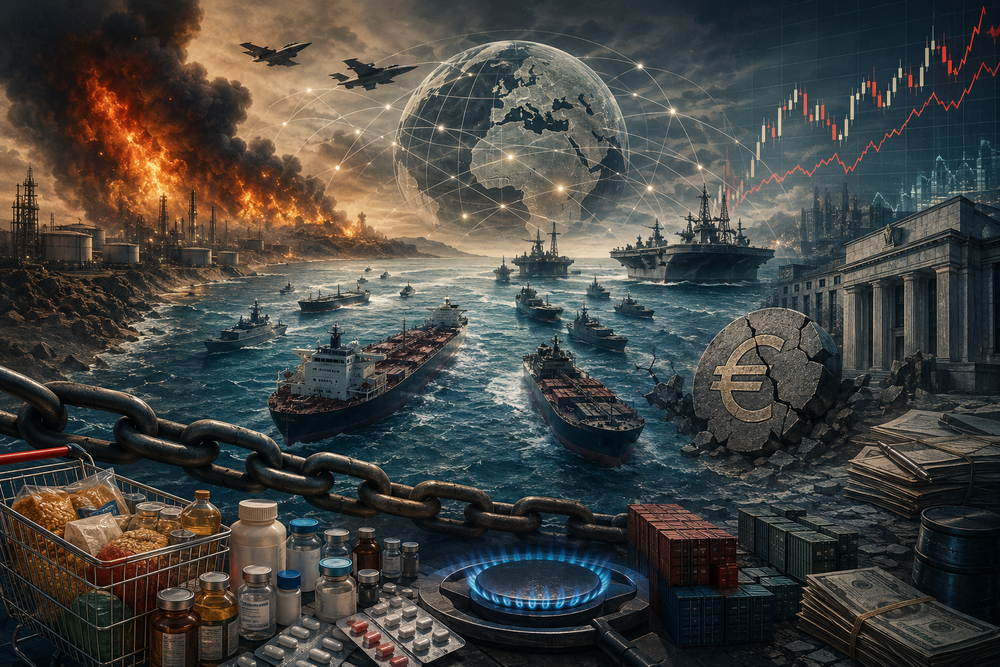
When movement stops, the illusion of abundance evaporates immediately. Not because goods disappear, but because the delivery rate collapses. Prices spike. Shortages appear. Supermarket shelves empty not because manufacturers stopped producing. They empty because goods are stuck in transit.
This happened in 2020. Shipping containers piled up in the wrong ports. Not because containers disappeared. Because movement slowed. Consumer prices rose 18 months later, but the initial signal was simple: goods stopped flowing.
Abundance is not a condition. Abundance is a rate of flow.
When the rate of flow declines, everything downstream experiences a shortage, regardless of total supply.
The Iran war is relevant to global economics not because Iranian crude disappears from markets. It is relevant because it disrupts the movement of crude through a corridor that handles roughly one-third of all global seaborne oil.
One corridor. Thirty percent of movement. When that corridor compresses, the entire system experiences buffer depletion.
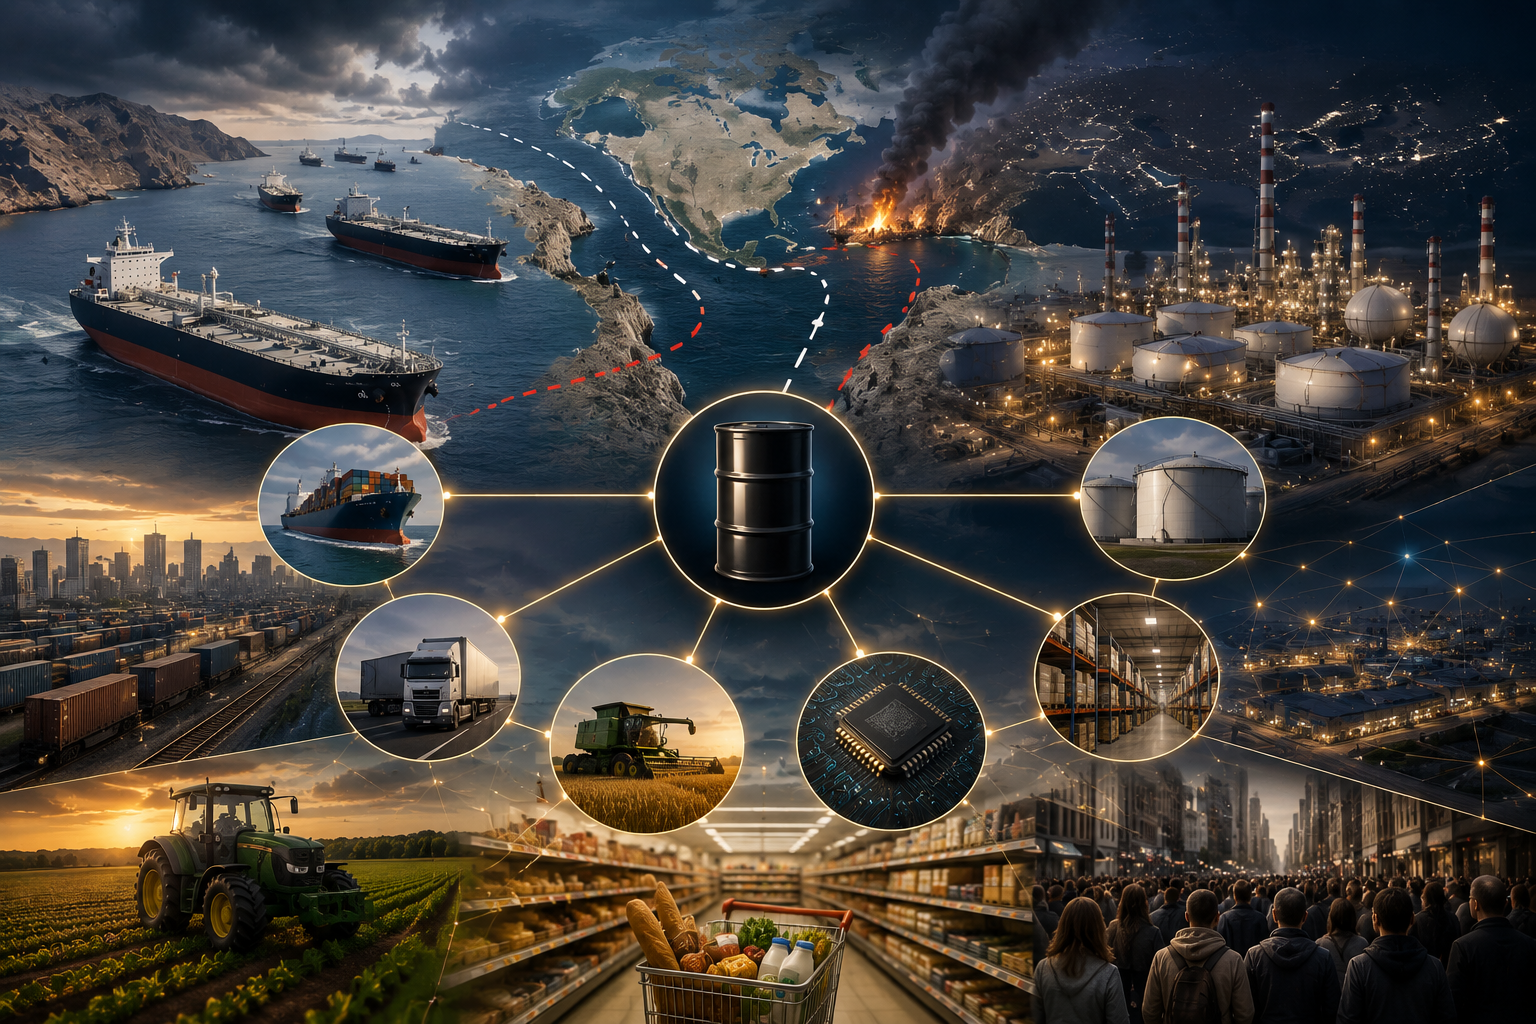
Oil Is Not Energy. Oil Is Movement Capacity.
Most people understand oil as fuel. Combustible energy. Chemical potential. That framing is incomplete.
Oil is stored movement capacity.
One barrel of oil contains the ability to move something across a distance. It fuels:
Container ships carrying manufactured goods across oceans. A large container ship burns 200 tons of fuel per day at cruising speed. A typical voyage from Asia to Europe consumes roughly 1,000 barrels of oil per ship. That is not energy burned. That is distance covered. That is goods moved.
Trucks delivering goods across continents. A standard truckload consumes 20-30 barrels over a 2,000-mile haul. The barrel is not consumed for heat. It is consumed to move 25 tons of goods over a specific distance.
Mining operations extracting raw materials. The diesel burned is not converted to electricity. It moves heavy equipment, transports ore, powers drilling. Mining is fundamentally a movement operation.
Agricultural machinery harvesting, processing, and transporting food. The diesel per hectare is not heating. It is movement capacity. A combine harvester consumes 15-20 gallons per hour. That fuel does not stay in the field. It moves grain from field to storage to truck to mill to warehouse.
Construction equipment. Railways. Warehouses maintaining inventory turnover. Logistics networks moving goods from origin to consumer.
Oil is not consumed. It is spent to create movement.
When oil becomes constrained, movement becomes constrained.
When movement becomes constrained, every system downstream becomes less efficient.
A factory does not close because it lacks electricity. It slows because raw materials arrive later, or finished goods cannot be shipped as quickly. A supermarket does not have empty shelves because food doesn't exist. It has empty shelves because the trucks carrying food move slower or cost more. A hospital does not run out of medications because they are not manufactured. It runs out because the pharmaceutical supply chain is designed for continuous movement, and disruption causes a cascade of delays.
This is not metaphorical. The price of oil is ultimately the price of movement capacity. When crude costs $100 per barrel, a truck operator knows exactly what cost that adds to each delivery. When crude costs $150 per barrel, the same truck operator knows the cost has risen 50 percent. What rises is not energy cost. It is movement cost.
Oil is priced for what it does, not for what it is.
When movement becomes expensive, every downstream system becomes more expensive. When movement becomes scarce, every downstream system becomes scarcer.
The Five Buffers That Enable Uninterrupted Movement
Most economic analysis focuses on normal operations. How much oil is produced per day? How many containers ship per month? What are standard freight rates?
What sustains civilization is not production or trading. It is the five buffers that absorb disruptions and prevent collapse:
Strategic reserves. National governments maintain stockpiles of crude oil, refined products, and food. The US Strategic Petroleum Reserve holds roughly 350 million barrels. OPEC nations maintain additional strategic reserves. The purpose is simple: if normal supply is disrupted, drawing down reserves buys time for supply to normalize. A reserve that cannot be drawn down is a reserve that has no function.
Spare production capacity. OPEC+ nations maintain production capacity that is not fully utilized in normal times. This slack allows rapid increase in output if supply shocks occur. It is a buffer against sudden disruption.
Commercial inventory. Warehouses, floating storage, logistics hubs, retail shelves. The global system maintains inventory that is not immediately consumed, specifically to smooth timing mismatches between production, shipping, and consumption. A supermarket shelf is a buffer. A warehouse is a buffer. Floating storage is a buffer.
Route flexibility. Supply chains do not operate on a single route. Companies maintain supplier diversity, shipping corridor alternatives, and logistics flexibility. If one route becomes expensive or difficult, goods can be rerouted. That flexibility is a buffer.
Financial elasticity. Trade finance letters of credit, insurance, credit lines allows movement to continue even when prices spike. A refinery with good credit can borrow to buy expensive oil when normal supply is disrupted. That financial flexibility is a buffer.
Each of these buffers has historically absorbed shocks: 2008 financial crisis, 2011 Japan earthquake, 2020 pandemic lockdowns.
The critical question is not whether buffers exist. The critical question is how much slack remains in each buffer right now.
The Transport Layer Where Friction Breaks the System
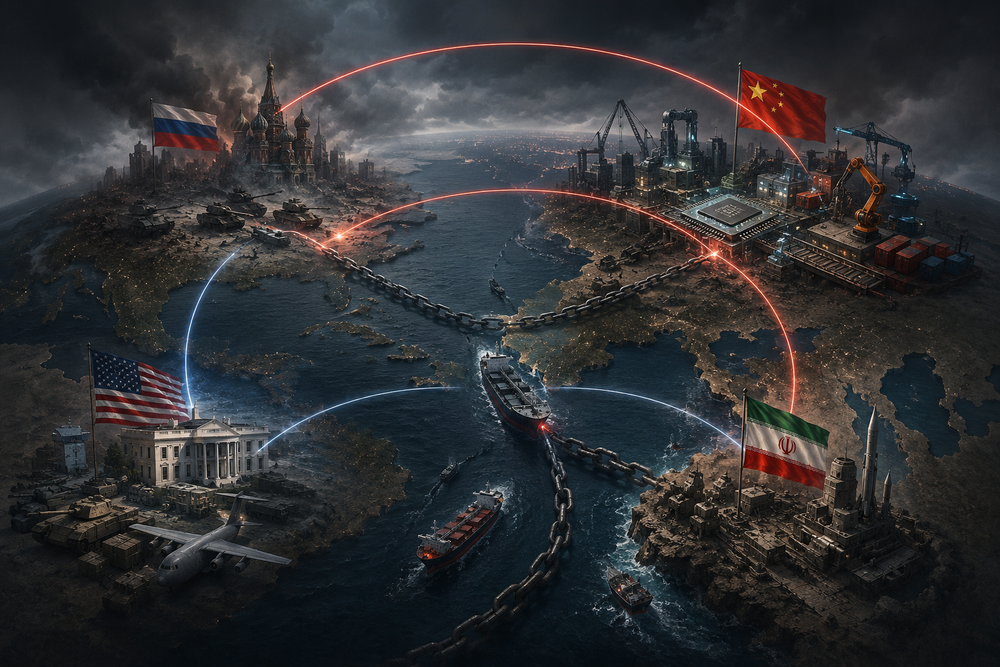
The Iran war disrupts movement through one physical chokepoint: the Strait of Hormuz.
Thirty percent of globally traded seaborne crude oil transits Hormuz. No other single corridor has that concentration of dependency. The Suez Canal carries roughly 12 percent of global maritime trade, but that traffic is diversified across many commodities. The Panama Canal similarly carries many goods. Hormuz carries one thing: oil and liquefied natural gas. And oil is the fuel that makes all other movement possible.
When conflict erupts near Hormuz, war-risk insurance for tankers transiting the strait becomes expensive. At baseline, war-risk premiums are roughly 0.5-1 percent of voyage value. Under conflict conditions, they can rise to 5-10 percent or higher.
A typical tanker voyage from the Persian Gulf to Europe carries a cargo value of roughly $50-100 million (depending on oil prices and cargo size). At 1 percent premium, war-risk insurance costs $500,000-$1 million per voyage. At 5 percent, it costs $2.5-5 million per voyage.
That cost is not absorbed by oil producers. It is passed through the supply chain. Insurance becomes expensive. Some tanker operators decide the premium makes the voyage uneconomical. They reroute around Africa, adding 10-14 days to transit time, additional fuel consumption, and additional insurance for the longer voyage.
The consequence is mechanical. Tankers that would normally transit Hormuz instead go around the Cape of Good Hope. This adds roughly 6,000 nautical miles to the journey, extending voyage time from approximately 20 days (illustrative baseline) to approximately 30-35 days. That additional time means the same tanker completes fewer voyages per year. A tanker normally makes an illustrative estimate of 8-10 voyages per year on the Hormuz route. Diverted, this declines to an illustrative 6-7 voyages.
With fewer voyages per tanker and some tankers choosing not to operate the Gulf routes at all, effective tanker capacity available for Hormuz crude declines. When supply through the strait becomes unreliable, refineries cannot operate their standard refining configurations. They must maintain higher inventory levels. Storage fills.
When oil movement slows, inventory that would normally be replenished begins to deplete. Refineries that expect fresh crude shipments every 20 days now receive them every 35 days. Storage tanks are drawn down faster than they are refilled.
When storage becomes depleted, refineries must reduce production to match the lower rate of incoming crude. Refined products—diesel, gasoline, jet fuel—become scarcer. Their prices rise.
Diesel Becomes the Chokepoint
Of all refined products, diesel matters most to the physical economy.
Diesel fuels long-haul trucks (which move approximately 70 percent of goods by weight across highways), agriculture (tractors, harvesters, irrigation), warehousing (forklifts, sorting, conveyors), power generation in regions without electrical infrastructure, and marine transport operations.
When diesel becomes expensive, distributed supply becomes uneconomical. Consolidation increases, efficiency decreases, and inventory tightens.
Food systems are designed for continuous movement of bulk goods over long distances. When that movement becomes constrained, food systems experience buffer depletion.
The cascade is mechanical: Transport constrained → Oil movement slowed → Diesel availability falls → Food movement costs rise → Food variety shrinks → Food prices rise → Food inflation enters broader economy.
This is not immediate. It takes weeks or months. But it is mechanical. It does not depend on additional shocks. It follows from the compression in the transport layer.
Chips Depend on Logistics
Beneath the digital layer is a physical supply chain of extraordinary fragility.
A semiconductor fabrication plant (fab) like TSMC requires inputs from suppliers globally: photoresists from Japan, rare gases from the US, precision chemicals from Europe. These inputs arrive on scheduled shipments. If shipments are delayed by what we model as 30 days, the fab must shut down sections of production.
ASML manufactures the machinery (EUV lithography machines) that makes advanced chips. These machines require roughly 100,000 precision components from suppliers across multiple continents. Component delivery delays directly impact production capacity.
The supply chain is optimized for cost and speed, not flexibility. When movement becomes constrained, semiconductor supply declines. A data center cannot run additional computing without more chips. A car manufacturer cannot increase production without more microcontrollers.
The constraint is physical. It cannot be overcome by price alone.
The Consumer Experiences Transport Breakdown as Scarcity
Most people do not follow supply chain logistics. Most people experience the global system through supermarkets, online shopping, and retail stores.
When the system is functioning normally, they experience full shelves, next-day delivery, low prices relative to income, high variety, and abundant choice.
When the system experiences buffer compression, they experience the opposite. Not because goods disappear, but because delivery slows (next-day becomes five-day), prices rise (shipping and labor costs increase), variety shrinks (distributors stock only best-sellers), and shelf life decreases (perishables move slowly and spoil).
The consumer does not experience a proportional reduction in food supply. The consumer experiences higher prices, smaller variety, and shorter shelf life.
From Infrastructure Stress to Political Stress
Governments pay attention to supermarket prices and shelf fullness.
When shelves are empty, voters assume government has failed. When prices show sustained quarterly increases (an illustrative range would be 5-10 percent per quarter under buffer compression), voters experience declining purchasing power and blame political leadership.
These signals reflect real system stress. A government cannot increase food production in 6 months. But governments face pressure to act.
Price controls create black markets. Strategic reserve releases deplete buffers. Rationing creates distortions. Each intervention addresses immediate political pressure. Each worsens long-term vulnerability.
Within 6-12 months of sustained infrastructure stress, political coalitions face increased pressure. Electoral cycles accelerate. New governments inherit the same problems with depleted reserves and less credibility.
The strongest case against this analysis is that political instability is primarily domestic: leadership failures, ideological fractures, regional power struggles. These are real and independent. But the timing and simultaneity of coalition pressure across different regions with fundamentally different political systems suggests a shared external cause. Infrastructure stress offers an explanation for that synchronization.
Political outcomes remain contingent and vary by country, but infrastructure stress historically increases pressure on governing coalitions. The 1973 OPEC embargo illustrates this pattern: energy crisis → government controls and rationing → stagflation → destabilization across developed nations with different political structures.
We are not in that scenario now. But the pattern is recognizable, and the structural pressure is observable.
The Disappearance of Slack
In 1980, the global economy carried more inventory, more spare production capacity, more reserve oil, and longer planning horizons. That excess looked inefficient.
So it was systematically removed.
Warehouses became smaller. Supply chains became longer. Inventories became leaner. Shipping became optimized for cost, not resilience. Production became concentrated in single locations. Every idle asset was treated as waste. Redundancy was eliminated.
The result was extraordinary efficiency. Every dollar of capital generated more throughput. Every worker moved more goods. Every dollar of inventory purchased higher velocity. The math was unambiguous. A system with 20 percent excess capacity looks like failure. A system with 2 percent excess capacity looks like success.
The modern economy did not accidentally become fragile. It systematically converted resilience into efficiency. That conversion looked like progress. In normal times, it was progress. In disrupted times, it is vulnerability.
The buffers still exist. Strategic reserves still exist. Spare production still exists. Commercial inventory still exists. The routes still exist. The finance still exists.
What disappeared was margin. What disappeared was slack. What disappeared was the capacity to absorb disruptions without cascading.
A system with 20 percent slack absorbs local disruption. A system with 2 percent slack amplifies disruption and propagates it globally.
Modern civilization operates at the edge of its own capacity. It is extraordinary efficient. It is extraordinarily fragile.
Buffer State Analysis—Which Buffers Are in Compression?
The question is empirical: Which buffers are actually in compression today?
None of the buffers are empty. That is what makes the situation difficult to see.
The reserves still exist. The spare production still exists. The inventories still exist. The routes still exist. The finance still exists.
What has disappeared is slack.
Strategic Energy Reserves: COMPRESSION
The US Strategic Petroleum Reserve holds approximately 350 million barrels, roughly 50 percent of historical capacity. At normal drawdown rates of 1.5 million barrels per day, current reserves provide approximately 5-6 months of release capacity before reaching minimum operating levels. SPR refills require global crude market normalization and are not currently being executed at scale.
Spare Production Capacity: COMPRESSION
OPEC+ nameplate capacity is approximately 95 million barrels per day. Actual production is approximately 88 million barrels per day. Documented spare capacity is limited to approximately 7 million barrels per day. Saudi Arabia maintains announced production cuts through mid-2026. Russia produces at approximately 10.5 million barrels per day; sanctions and infrastructure constraints limit expansion. Iran operates at approximately 3-3.5 million barrels per day; sanctions limit expansion.
Commercial Inventory and Storage: COMPRESSION
Global floating storage utilization is approximately 70 percent of available capacity. US commercial crude oil inventory is below 5-year average. OECD refinery inventory levels are below historical 10-year average. Global warehouse utilization is approximately 85 percent. Surge capacity remaining: approximately 15 percent spare warehouse capacity and 30 percent spare floating storage capacity.
Transport and Route Flexibility: COMPRESSION
War-risk insurance premiums for Persian Gulf transit have risen materially above baseline. Tanker operators are evaluating route alternatives (Cape of Good Hope routing). If a material percentage of tankers adopt longer routes, effective global tanker capacity declines by approximately 15-25 percent due to longer voyage cycles. Major ports report elevated berthing queues. Lloyd's and underwriters have adjusted capacity guidelines for Gulf coverage.
Trade Finance: COMPRESSION
Letter of credit spreads for Gulf energy trade have increased by approximately 100-150 basis points above baseline. Major trade finance banks have adjusted exposure guidelines for Iran-adjacent transactions. Credit spreads for emerging market energy importers have widened 50-100 basis points. Banks report elevated caution on vessel financing for Gulf-route shipping, with higher collateral requirements.
THE CRITICAL OBSERVATION
Each buffer, examined individually, shows compression but not failure. None are exhausted.
But when all five buffers compress simultaneously, the system loses redundancy. Pressure that one buffer would normally absorb must be absorbed by another. When one fails, the others inherit the shock without excess capacity to handle it.
Current System State (as of June 4, 2026):
Energy reserves: Compressed. Production capacity: Compressed. Inventory: Compressed. Transport routes: Compressed. Trade finance: Compressed.
This buffer compression reflects the structural pressure described in the preceding analysis: Iran indefinite stalemate, Western timeline 12-24 months, Asian timeline 18-36 months. The system is not in acute crisis. It is in sustained stress.
When all buffers are compressed, the system becomes fragile. A second shock cannot be absorbed. A third shock cascades. The system enters a state where disruption propagates rather than is contained.
What This Means
The question is not whether disruption will occur. The question is what form it takes, and how much additional stress the system can accommodate before the slowdown from invisible becomes undeniable.
The system sustains itself through five interlocking buffers: reserves, production slack, inventory, route flexibility, and financial elasticity.
When all five buffers are compressed simultaneously, the system loses redundancy. It enters a state where disruption propagates rather than is contained.
When throughput slows, abundance does not disappear all at once. It disappears one delayed tanker at a time. It disappears as warehouse space fills. It disappears as storage tanks are drawn down faster than they are replenished. It disappears as diesel becomes scarce, food movement slows, prices rise, and voters blame leadership for failures of infrastructure rather than policy.
Abundance is not a stockpile, it is a flow.
Jerry van der Laan writes The Manifest Archive. Essays on power, language, and institutional mechanics appear at themanifestarchive.com.
Related from The Manifest Archive